Trading View Pine Script for 52 Week Low Contrarian Investment Strategy
There is an updated version of this script here.
I created this TradingView Pine script for backtesting the longer term contrarian investing strategy of buying stocks at 52 week lows. For an in depth look at this strategy and extensive backtesting proof it works, read “The 52 Week Low Formula” by Luke L. Wiley CFP (John Wiley & Sons, 2014). Also check out my ETF site below for further proof.
- My PineScript on TradingView (the code is also listed further down this page).
- Find Exchange Traded Funds (ETFs) at 52 week lows on my site here.
- Free scanner for finding US, UK and EU stocks at 52 week lows here.
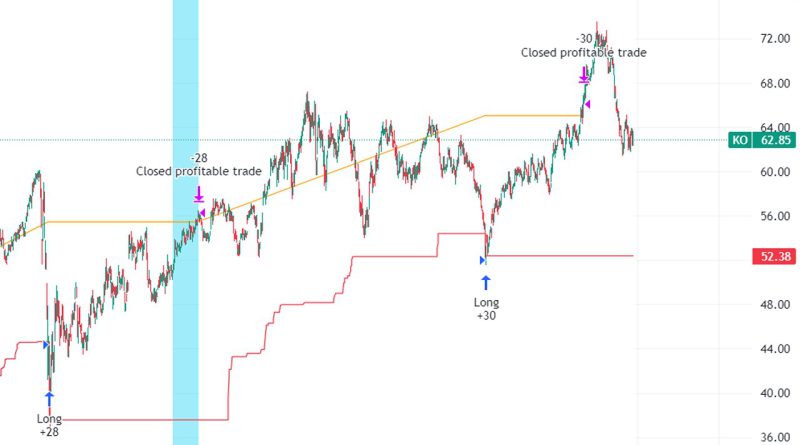
The script needs to be used on the daily chart. It will work best with high quality dividend stocks in long term monthly uptrends (e.g. PEP, MCD, KO, ELV). I would not recommend using the script for actual trading – just use it for backtesting.
The strategy buys at the first 52 week low then holds for a specific number of days. If the profit target % is reached the stock is sold for a profit. If the target is not reached after 12 months then the target is changed to breakeven. There is no stop loss. With most quality stocks they will tend to revert to a breakeven price at some point in the future. It’s also possible to collect dividends while hodling.
Setting a higher percentage profit target does not necessarily lead to higher returns. My research suggests an 8-10% profit target results in a higher CAGR. To achieve market beating returns the investor will need to rotate between different stocks.
This is not financial advice, dyor etc. etc.
This is my first published Pine script so let me know if there’s anything I can do to improve it.
Backup of the Script
//@version=6
strategy("52 Week Low Fixed 25% Profit Investment Strategy",shorttitle="52 Week Low 25% Investment Strategy",overlay=true,initial_capital=1000, default_qty_value=100, default_qty_type=strategy.percent_of_equity)
//52 week low longer term contrarian investing strategy. **USE IT ON THE DAILY CHART**
//Works best with high quality dividend stocks in long term uptrends (e.g. PEP, MCD, KO, ELV).
//The strategy buys at the first 52 week low then holds for a specific number of days. If the profit target % is reached the stock is sold for a profit.
//If the target is not reached then the target is changed to breakeven. There is no stoploss. With most quality stocks they will tend to revert to
//a breakeven price at some point in the future. It's also possible to collect dividends while hodling.
//
//This is not financial advice, dyor etc. etc.
//This is my first published Pine script so let me know if there's anything I can do to improve it.
//

PercentageProfit = 25 //Change this to your desired % profit. Note: a higher % usually significantly reduces CAGR so you don't necessarily make a higher return!
HodlTimeInDaysAwaitingProfit = 365 //Number of days to wait after buying the stock before the trade is changed to breakeven mode
//Change values below for longer/shorter backtesting time periods:
StartDate = input.time(defval=timestamp('01 Jan 2010 00:00 +0000'), title='Start Date')
EndDate = input.time(defval=timestamp('31 Dec 2050 00:00 +0000'), title='End Date')
//Script Tips:
//* Be sure to use on a daily chart
//* IMPORTANT: the script's buy/sell triggers aren't always accurate so don't rely on it for actual trades - it's best used as a strategy tester.
//* In real life buying further significant 52 week lows can work. Again, it should be a quality stock with recovery potential.
//* For shorter term profits and better CAGR, a 8-10% profit target can work extremely well. My backtesting suggests a 10-25% CAGR is achievable
//   by rotating in and out of quality stocks making 52 week lows. Be wary of anything coming off a bubble and anything sliding with no bounces.

IsInDateRange=time>=StartDateandtime<=EndDate
Profit = (PercentageProfit / 100) + 1
BuyTrigger = ta.lowest(close, 365)[1]
SellTrigger = strategy.opentrades.entry_price(0) * Profit
InTrade = strategy.position_size > 0
NotInTrade = strategy.position_size <= 0
BuySignal = ta.crossunder(low, BuyTrigger)

SellForProfitSignal = ta.crossover(low, SellTrigger)
BreakevenSignal = InTrade and (time > ( strategy.opentrades.entry_time(0) + (86400000 * 365)))

SellForBreakevenSignal = ta.crossover(close, strategy.opentrades.entry_price(0)) and BreakevenSignal
bgcolor(BreakevenSignal ? color.rgb(21, 207, 244, 60) : color.white) //Light blue background signifies we've been hodling stock for over 365 days

plot(BuyTrigger, color=color.red)
plot(SellTrigger, color=color.orange)

if (IsInDateRange and BuySignal)
    strategy.entry("Long", strategy.long)
    SellTrigger := strategy.opentrades.entry_price(0) * Profit

if (IsInDateRange and BreakevenSignal and InTrade)
    SellTrigger := strategy.opentrades.entry_price(0)

if (IsInDateRange and InTrade and SellForProfitSignal)
    strategy.close("Long", "Closed profitable trade")

if (IsInDateRange and InTrade and SellForBreakevenSignal)
    strategy.close("Long", "Closed breakeven trade")

if (not IsInDateRange)
    strategy.close_all()


